
Boosting Student Retention with Data: A 3-Part Journey Behind BGSU’s Record-Breaking Year
In Fall 2023, Bowling Green State University hit a milestone: its highest-ever student retention rate and one of the largest incoming classes in school history. But behind that headline was years of quiet, intentional work—much of it in data.
Over the course of three years, I worked as a Data Manager and Analyst, helping build a full-stack system of insights, predictions, and dashboards that supported students and empowered advisors. We pulled together thousands of scattered data points, trained machine learning models to identify patterns in student behavior, and built dashboards that helped humans make better decisions—faster.
In this blog series, I’m walking you through the behind-the-scenes of this project in three parts:
- Data Crawling & Automation — The deep work of gathering and preparing the data.
- Predictive Analysis with Machine Learning — How we built models that made sense and impact.
- Designing Power BI Dashboards + Reflections — Turning insight into action (and what I’d do differently next time).
Let’s start at the beginning—where all good data stories begin: with the chaos of data collection.
Chapter 1: Data Crawling and Automation — Taming the Chaos Before the Magic
You know what doesn’t get enough credit in data science? The messy, unglamorous, deeply necessary first step: collecting and cleaning the data.
Before any machine learning model can work its magic, before dashboards can dazzle a room of stakeholders, there’s this foundational—but often invisible—work of actually getting the data in the first place. And at a university? That’s a jungle.
Let me walk you through how we took a disconnected maze of information and turned it into a clean, reliable, automated data pipeline—the unsung hero of our retention analytics system at BGSU.
What We Were Dealing With
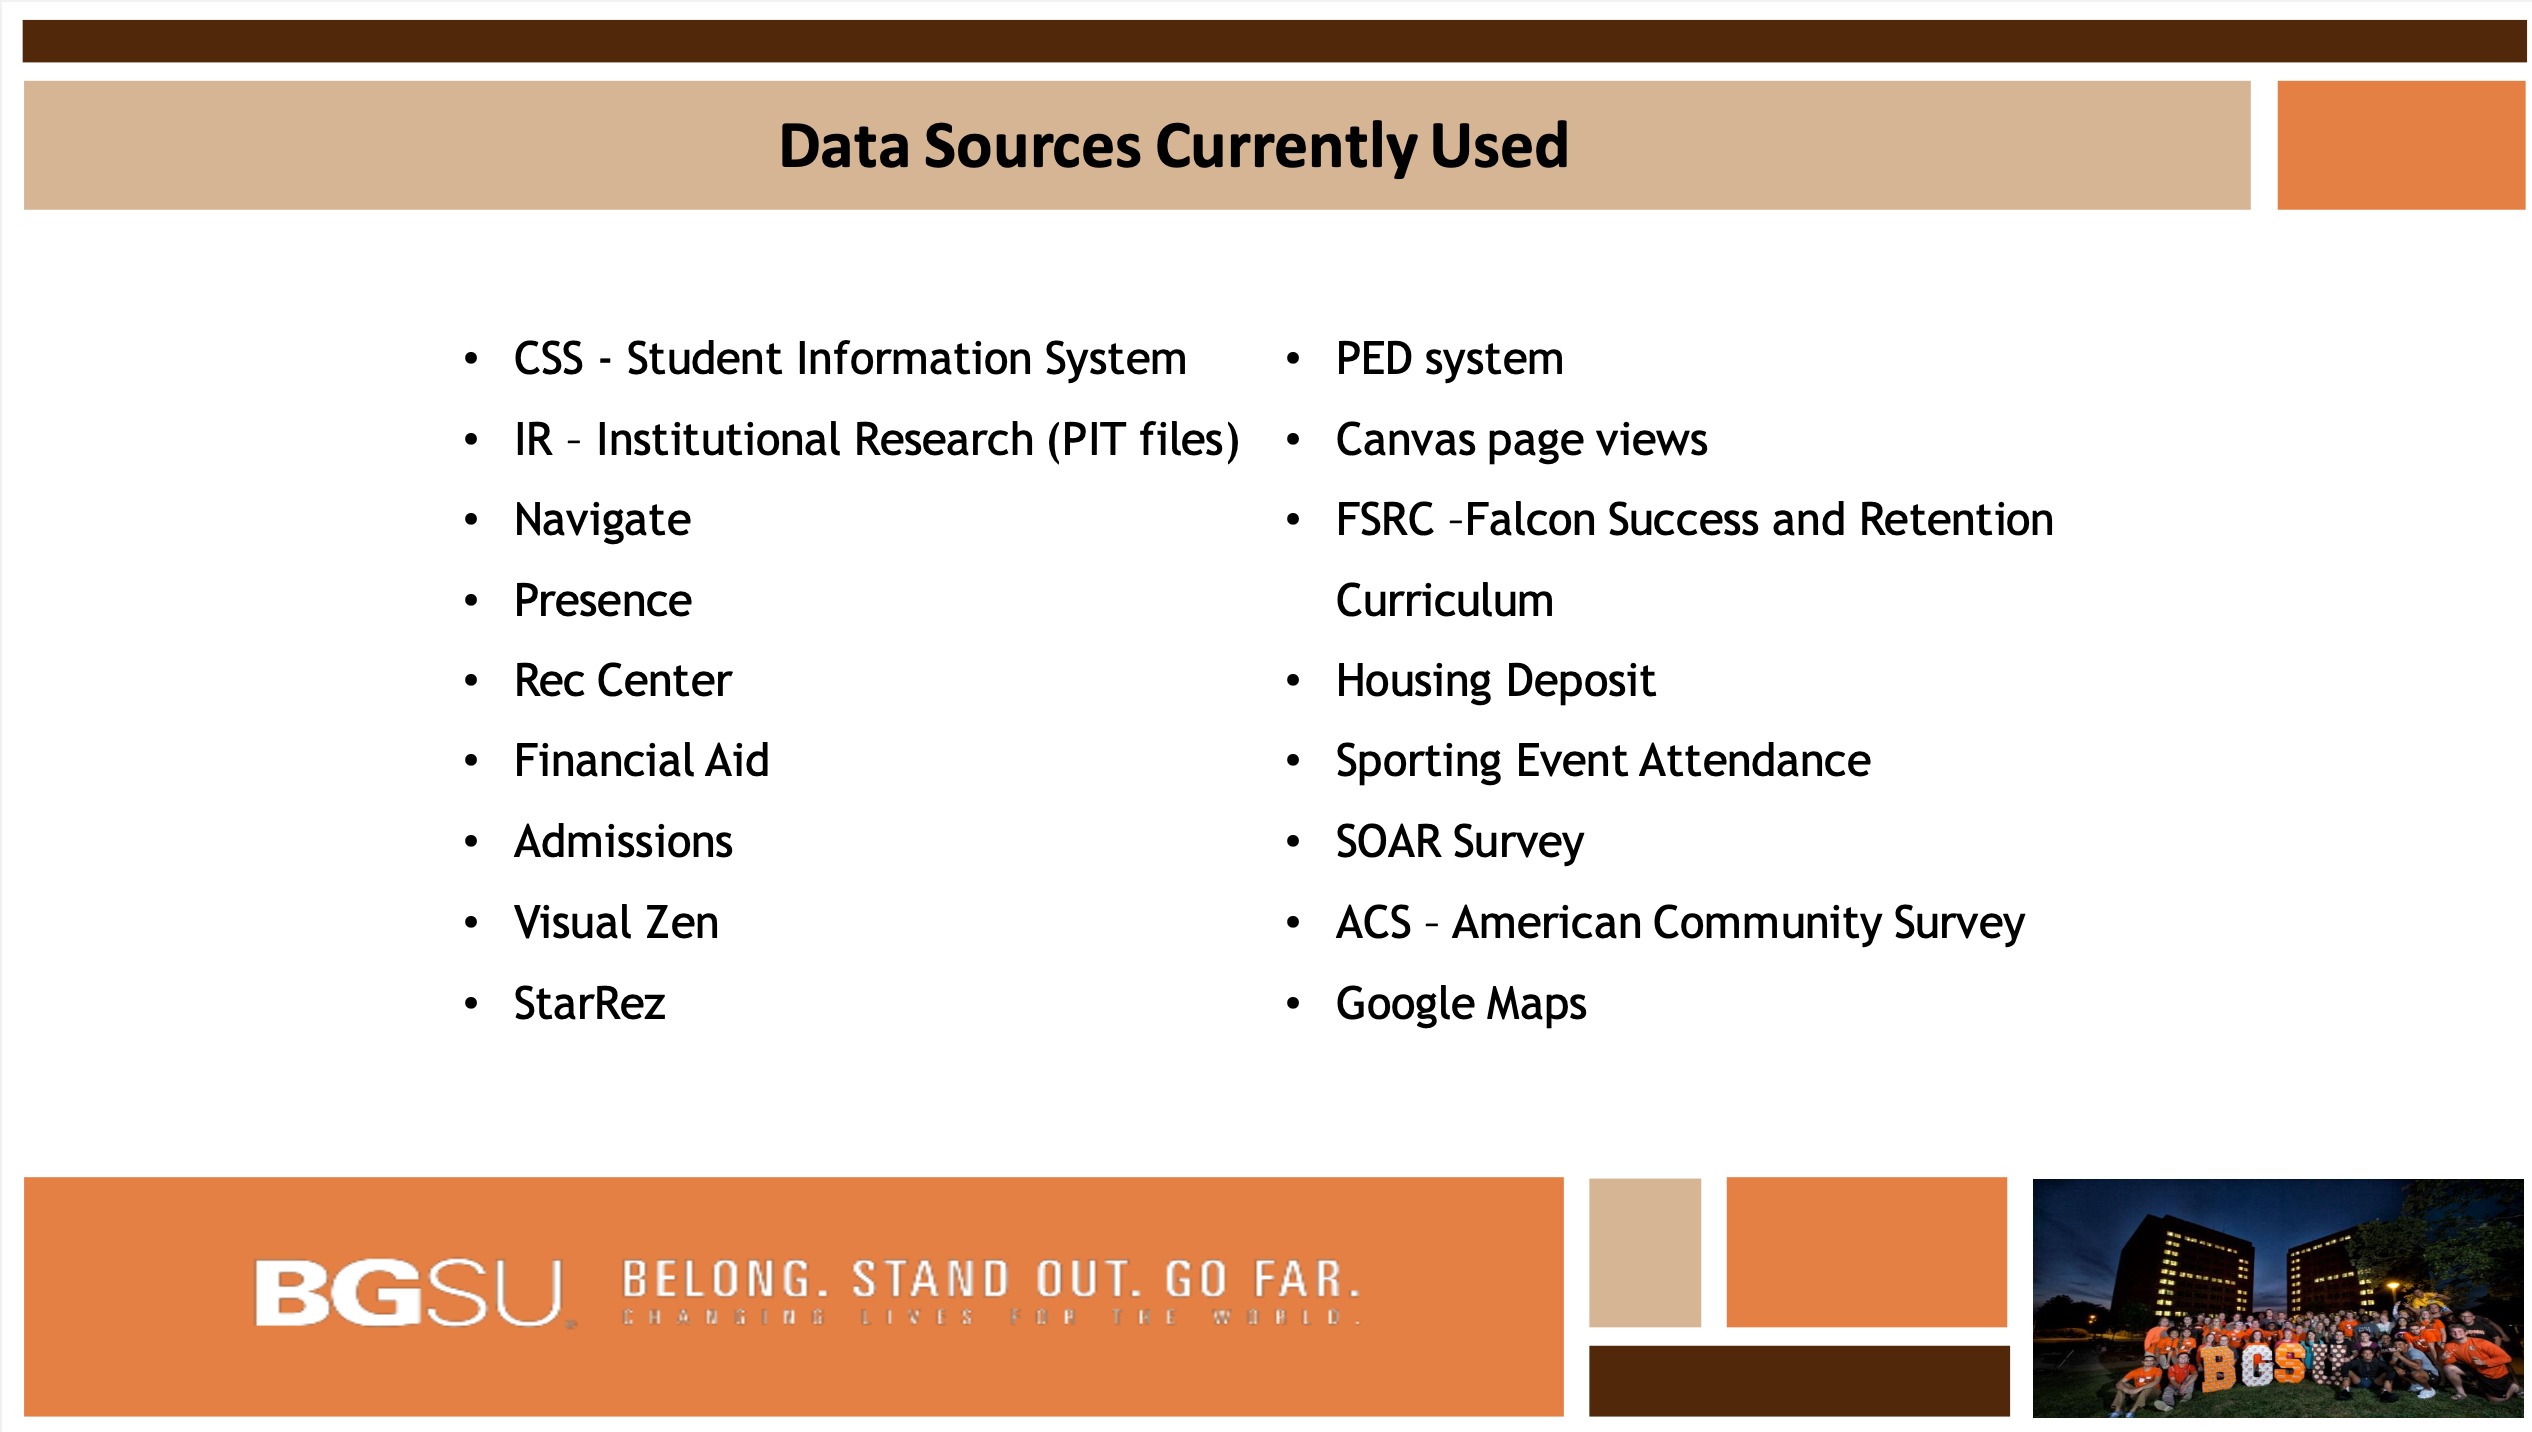
Our goal was to understand students holistically—academics, engagement, behaviors, trends. But here’s what that actually meant in data terms:
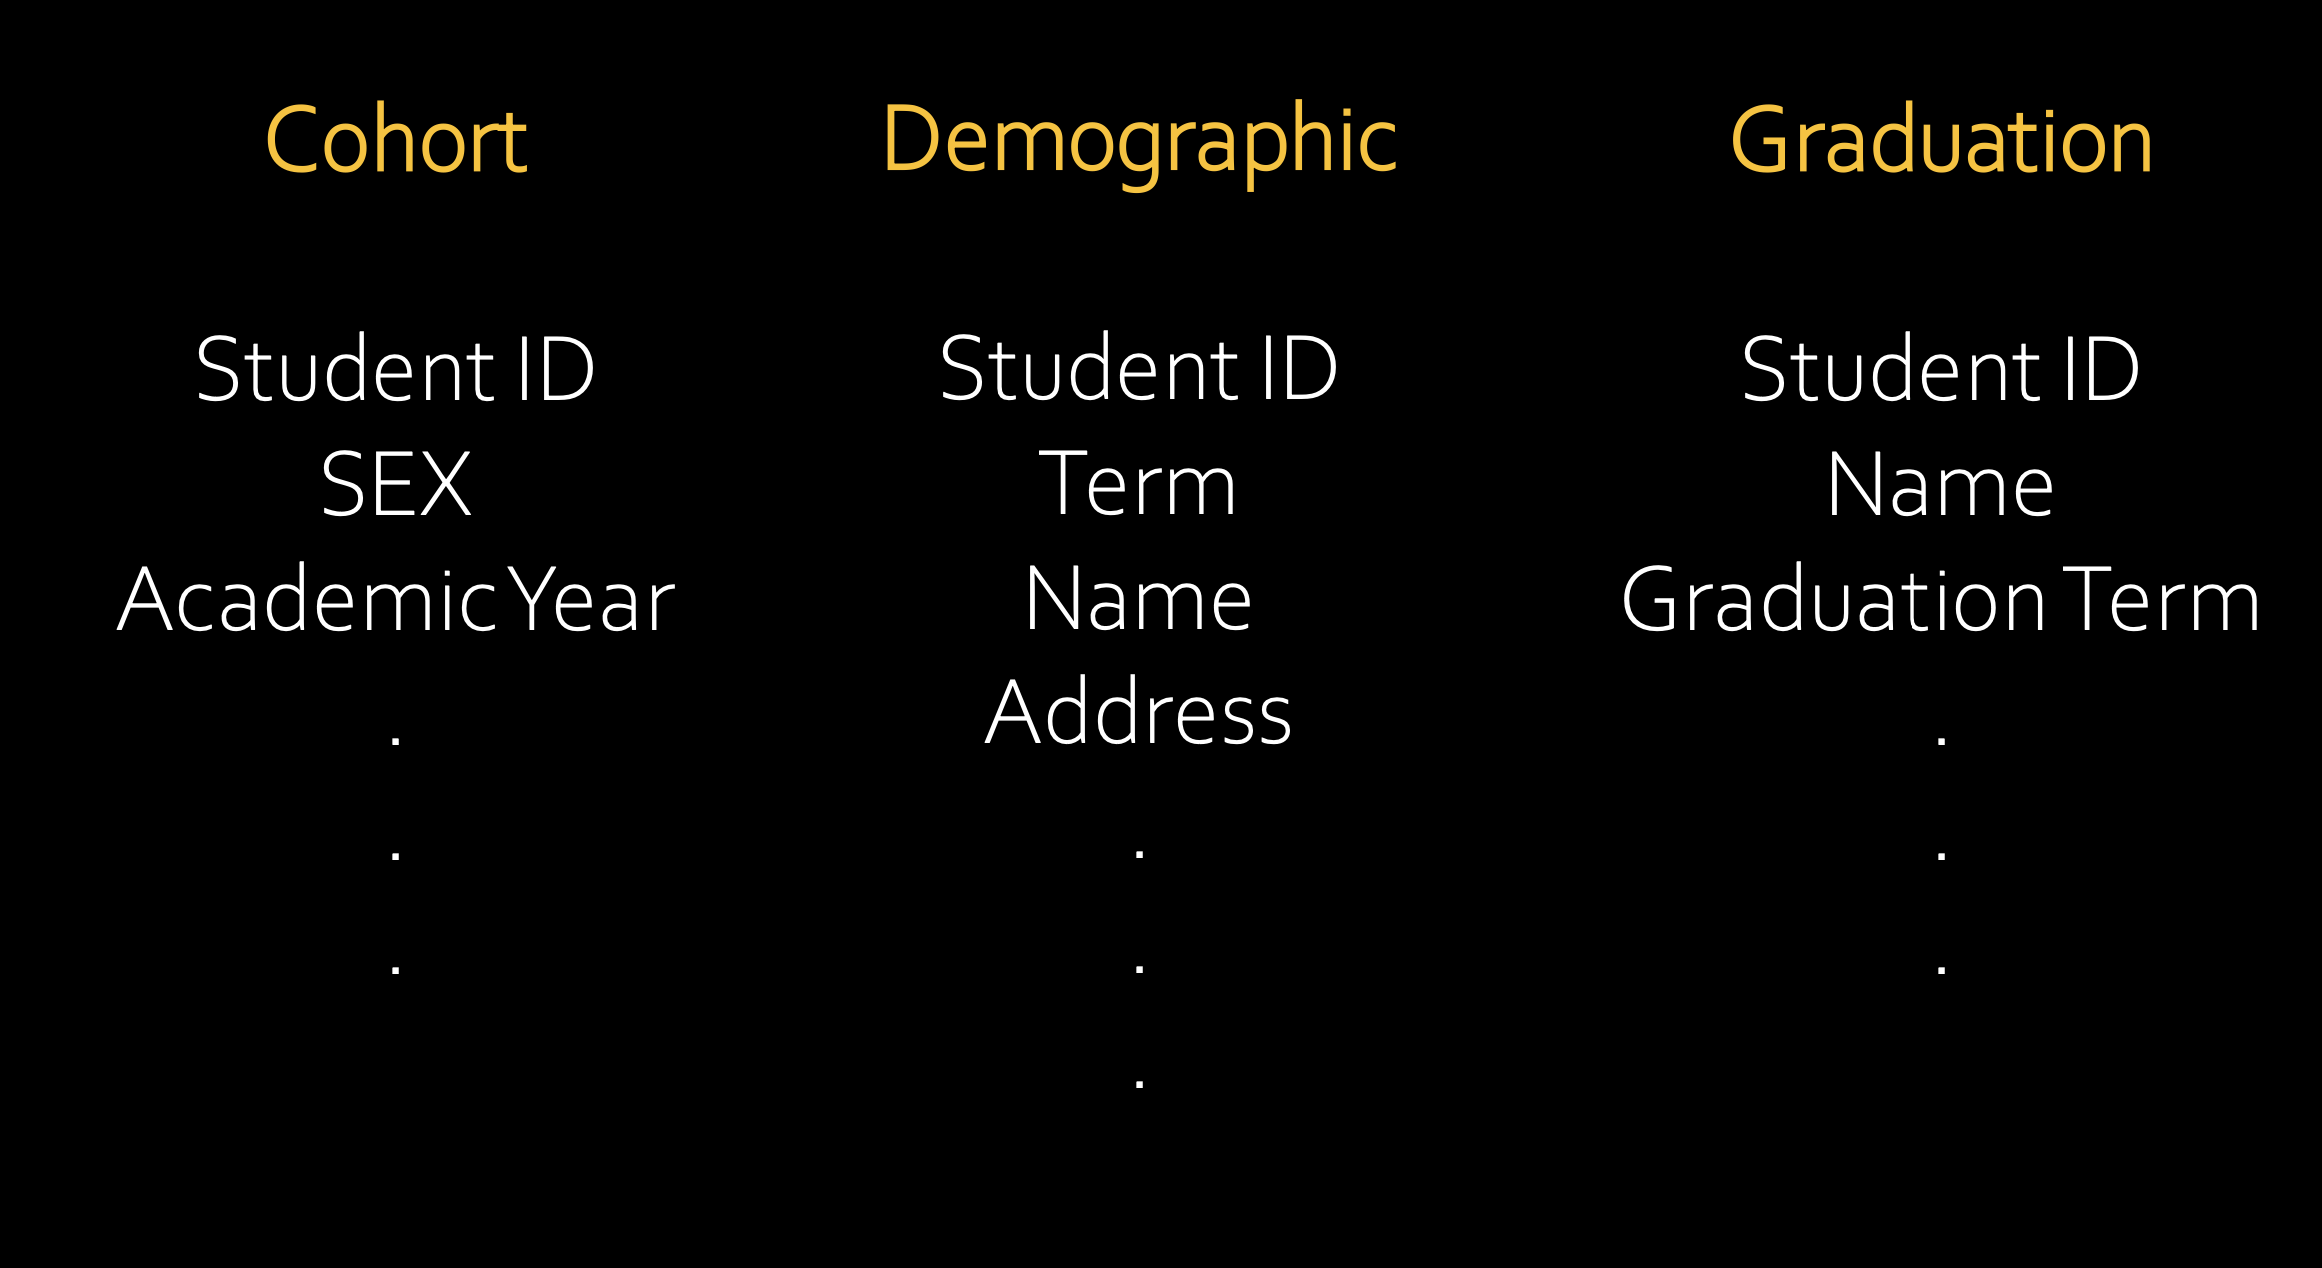
- Grades and academic history from structured SQL databases (✓ some stability here)
- Event attendance (club meetings, guest lectures, leadership workshops) scattered across department-specific platforms
- Student service usage (like tutoring or mental health check-ins), stored behind login-protected university tools
- Advising interactions, some structured, some entered manually into SharePoint or internal forms
- Class engagement data, exported as PDFs or embedded into static HTML reports
We didn’t just have "many sources." We had:
- Different formats (JSON, CSV, HTML, PDF, SQL)
- Different update frequencies (some daily, some monthly, some unknown)
- No APIs for half of them
The TL;DR? There was no clean pipeline to rely on. So I built one.
Step 1: Web Crawling and Extraction with Python
For the tools that didn’t offer data export or integration, I turned to BeautifulSoup + Requests to simulate user actions and scrape data directly from web pages.
A Real Case: Scraping Student Event Participation Logs
One department published a daily list of students who had attended co-curricular events. But there was:
- No CSV export
- No copyable table
- No API
- A table buried behind two login forms and multiple redirects
The workflow looked like this:
- Login through an authentication portal (using a
requests.Session()to persist the session). - Navigate through a JavaScript-redirected page (which I reverse-engineered by inspecting the HTTP headers).
- Scrape a paginated table, split across multiple URLs.
- Normalize the HTML table into usable rows, mapping each field to a schema.
- Export daily to CSV + insert into our master PostgreSQL table.
Here’s a stripped-down version of one of the daily automation scripts:
import requests
from bs4 import BeautifulSoup
import pandas as pd
from datetime import datetime

# Session to handle login cookies
session = requests.Session()

# Step 1: Log in
login_url = "<https://portal.bgsu.edu/login>"
credentials = {"username": "my_username", "password": "my_password"}
session.post(login_url, data=credentials)

# Step 2: Go to the event data page
data_url = "<https://portal.bgsu.edu/life/events/logs>"
response = session.get(data_url)

# Step 3: Parse with BeautifulSoup
soup = BeautifulSoup(response.text, "html.parser")
table = soup.find("table")
rows = table.find_all("tr")

# Step 4: Convert to DataFrame
data = []
for row in rows[1:]:
    cols = [col.text.strip() for col in row.find_all("td")]
    data.append(cols)

df = pd.DataFrame(data, columns=["StudentID", "Event", "Date", "Hours"])
df["ScrapedDate"] = datetime.now().strftime("%Y-%m-%d")
df.to_csv("event_log_daily.csv", index=False)
Pro Tip:
We discovered that the HTML layout changed every few months when IT teams updated the platform. So I wrapped the scraper in a try-except email alert system that notified me if the page structure broke unexpectedly.
Step 2: Automation and Scheduling
Once the crawlers were working, we needed them to run daily without manual triggers.
I used Windows Task Scheduler to run scripts every morning before 6 AM. Each script logged its own status, sent an email notification, and backed up to a cloud drive.
To orchestrate the flow, I added the following structure:
/data-pipeline
  /scripts
    - crawl_events.py
    - crawl_advising.py
    - crawl_athletics.py
  /logs
    - events_2023-10-04.log
  /data
    - events_2023-10-04.csv
  run_all.bat
The .bat file looked like this:
@echo off
python crawl_events.py
python crawl_advising.py
python crawl_athletics.py
This made it easy to version, manage, and debug everything in one go.
Step 3: Data Cleaning and Normalization
Web data is rarely ready for analysis.
Some common issues I encountered:
- Student IDs in multiple formats (
000123456,123456,STU-123456) - Inconsistent date formats (
MM/DD/YYvsYYYY-MM-DD) - Typos in event names entered by humans
- Duplicate records from delayed server refreshes
Cleaning Strategy
Using Pandas, I built reusable functions for:
- ID normalization with regex patterns
- Timestamp conversion
- Null filtering and forward-filling missing values
- Event category tagging (e.g., grouping “Leadership Seminar” and “Leadership Panel” under one tag)
def normalize_student_id(raw_id):
    return raw_id.replace("STU-", "").zfill(9)

df["StudentID"] = df["StudentID"].apply(normalize_student_id)
df["Date"] = pd.to_datetime(df["Date"], errors="coerce")
df.dropna(subset=["StudentID", "Date"], inplace=True)
Step 4: Storing and Syncing the Data
After processing, all cleaned datasets were:
- Exported as CSV backups
- Uploaded to SharePoint for access by other teams
- Stored in a central PostgreSQL database for downstream ML and BI access
This created one single source of truth. Whether a stakeholder was building a Power BI report or training a model, we all had access to the exact same cleaned dataset.
What Changed After Automation
Before this system, advisors often worked with outdated, siloed data. Each department had their own sheet, their own logs. Some were updated monthly, some not at all.
After automation:
- We had daily insights into student behavior
- Data-driven decision-making became a default, not a luxury
- Models could actually learn from consistent, timely inputs
- No one had to ask, “Is this data up to date?”
Final Thoughts on the Crawl Phase
Getting clean, reliable student data wasn’t the sexy part of this project—but it was the most essential. It laid the foundation for everything that followed: models, dashboards, interventions.
Without trust in the data, we couldn’t build trust in the decisions.
In Chapter 2, I’ll walk you through how we turned this cleaned, structured dataset into a predictive tool that helped advisors spot at-risk students early—before they considered dropping out.
Stay tuned. We’re about to get into the machine learning engine room.


